
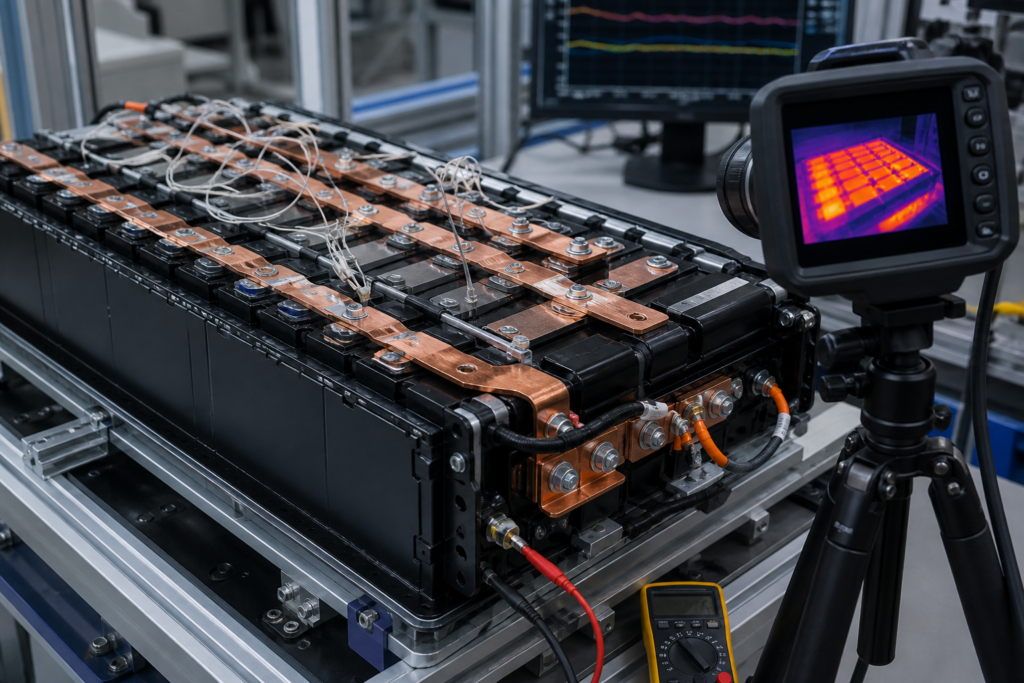
Battery busbar sizing cannot be reduced to one current-density number. A copper strip that appears adequate by cross-sectional area may still overheat at a bolted joint, a necked region, a fuse feature, or an enclosed corner with poor cooling. The engineering task is to predict resistance and heat generation, then prove the assembled battery pack under the real current profile, ambient range, cooling state, mechanical tolerances, and aging stresses.
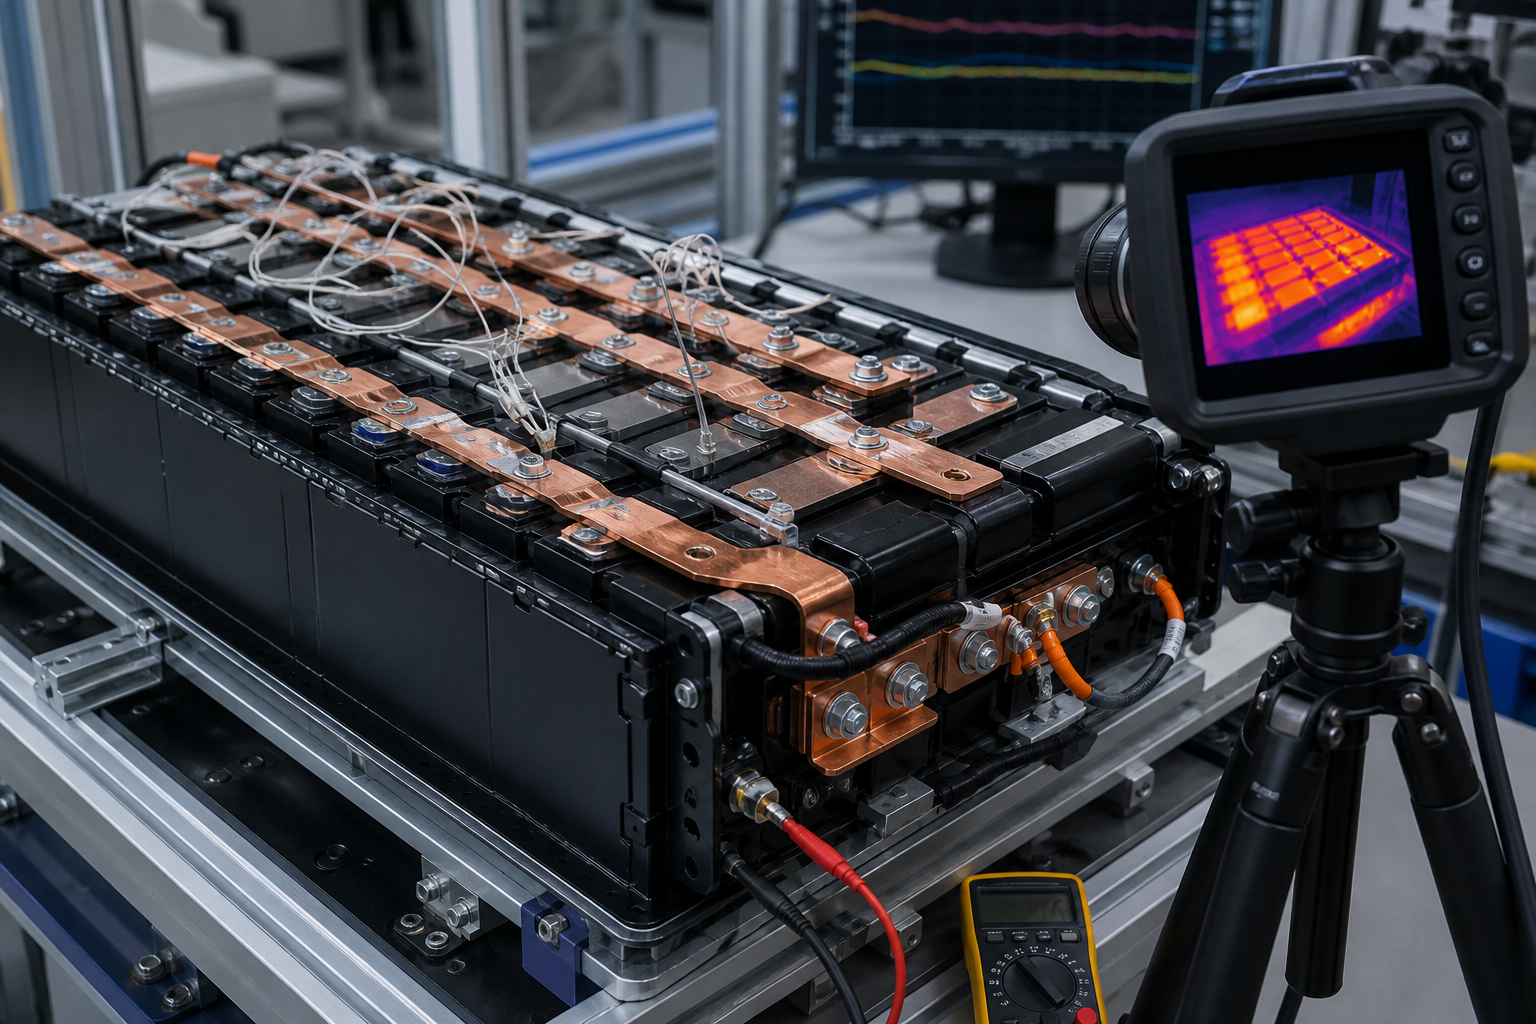
This guide gives industrial battery designers, forklift and AGV integrators, energy-storage engineers, and OEM buyers a traceable method for reviewing LiFePO4 pack busbars. It covers first-pass calculations, joint resistance, thermal measurement, fault cases, and supplier evidence. It does not assign a universal allowable temperature or current density; those limits must come from the approved cell, insulation, connector, enclosure, certification, and application requirements.
Start with current paths and duty cycles
Map every current path from cell terminals to the external connector. Identify parallel branches, contactors, fuses, shunts, flexible links, welded joints, bolted joints, connector blades, and chassis clearances. For each segment, record material, temper, plating, length, width, minimum thickness, hole pattern, bend radius, and manufacturing tolerance.
Define more than a continuous current. The validation profile should include normal charge and discharge, repeated acceleration or lift events, regenerative current, short-duration peak current, standby loads, imbalance between parallel branches, cooling start and stop, and credible abnormal operation. A forklift pack, an AGV swap battery, and a stationary ESS rack can have the same nominal voltage yet impose very different thermal duty.
The IEC page for IEC 61439-1:2020 highlights temperature-rise verification and DC requirements for low-voltage assemblies. A battery pack is not automatically an IEC 61439 assembly, but the standard's verification mindset is useful: define service conditions, rated currents, construction, and acceptance evidence rather than accepting an isolated current-density claim.
Calculate conductor resistance and heat
For a uniform conductor at a reference temperature:
-
Cross-sectional area A = width x thickness.
-
Resistance R = resistivity rho x length L / area A.
-
Voltage drop V = current I x resistance R.
-
Heat generation P = current squared x resistance R.
Worked copper-busbar example
Consider a 450 mm long copper busbar with a nominal width of 30 mm and thickness of 3 mm. Its nominal area is 90 mm2, or 90 x 10^-6 m2. Using an illustrative copper resistivity of 1.72 x 10^-8 ohm-m at 20 degrees C, the conductor-only resistance is:
-
R = 1.72 x 10^-8 x 0.45 / (90 x 10^-6) = 86 micro-ohms.
At 250 A, conductor voltage drop is about 21.5 mV and heat generation is 250 squared x 86 micro-ohms = 5.38 W. Current density is 250 / 90 = 2.78 A/mm2, but that number alone does not determine temperature.
Now add two bolted interfaces measured at 40 micro-ohms each. Their combined 80 micro-ohms generates another 5.0 W at 250 A. The joints therefore create almost as much heat as the 450 mm conductor. If clamp load, flatness, oxide, contamination, plating, washer stack, or torque changes, the joint loss can dominate.
The Copper Development Association busbar tables demonstrate that allowable current depends on temperature-rise assumptions and surface emissivity. Treat published ampacity tables as documented references for preliminary design, not proof of the assembled battery configuration.
Correct the model for real geometry
The simple formula assumes uniform area and current distribution. Real parts contain holes, slots, bends, narrow bridges, weld lands, and overlapping joints. Check minimum measured thickness and the narrowest current-carrying section. At current transitions, evaluate crowding and local heat flux. A thermal or electrical simulation can locate risk regions, but it needs measured material properties, contact resistance, boundary conditions, and mesh convergence evidence.
A NASA battery-development report includes busbar electrical-resistance modeling that compares design geometries and predicted resistance. The useful lesson is not to copy its numbers into another pack; it is to treat geometry as a measurable design variable and correlate predictions with hardware.
Temperature raises metal resistance. Therefore a hot busbar generates more loss at the same current than its 20 degrees C calculation predicts. State the resistivity and temperature coefficient used, then iterate the electrical and thermal model or apply an approved conservative method. Include plating and base-metal tolerances rather than modeling an ideal nominal section.
Control joint resistance at its sources
Bolted joints need defined contact surfaces and clamp load. Specify plating, cleaning, allowable scratches, flatness, burr control, fastener grade, washer stack, lubrication policy, tightening method, torque-angle or direct-tension evidence where relevant, and rework limits. Torque is a process input, not a direct measurement of electrical contact quality.
Measure joint resistance with a suitable four-wire method. Place potential leads so the result includes the intended interface but excludes unrelated conductor length. Record test current, polarity if relevant, stabilization time, instrument identity, lead locations, temperature, and acceptance limit. A single two-wire multimeter reading is usually dominated by lead and contact resistance.
Resistance should be compared before and after stresses that can relax or damage the joint. Depending on the application, these may include thermal cycling, vibration, mechanical shock, humidity, corrosion exposure, service disconnection, and repeated charge-discharge cycling. Link the plan to the mechanical evidence in the battery module end-plate correlation guide when compression and enclosure deflection can affect joint alignment.
Design a credible temperature-rise test
The test article must represent production materials, geometry, fasteners, torque process, enclosure, insulation, cell arrangement, cables, contactors, cooling hardware, and firmware. An open-air busbar coupon cannot validate an enclosed pack.
Use calibrated thermocouples or resistance sensors at predicted hot spots, joints, narrow sections, terminals, neighboring cells, insulation barriers, contactors, and reference ambient locations. A thermal camera can reveal patterns, but emissivity, reflections, viewing angle, focus, and blocked surfaces can mislead. Correlate camera readings with contact sensors on representative surfaces.
The BMS thermistor placement guide provides a related method for thermal-risk mapping and sensor coverage. Busbar validation should distinguish development instrumentation from production BMS sensing; a pack may pass a laboratory test while its production sensors cannot detect the local hot spot.
Record current, voltage, busbar and joint temperatures, cell temperatures, ambient, airflow or coolant conditions, pack state of charge, BMS limits, contactor state, and elapsed time. Define thermal stabilization before testing. A useful criterion is a declared rate of temperature change over a declared period, but the exact threshold belongs in the approved test plan.
Execute a thermal and electrical test matrix
At minimum, evaluate these conditions where applicable:
-
Nominal continuous discharge at maximum declared ambient with normal cooling.
-
Repeated peak-current profile representing the real forklift, AGV, or ESS duty cycle.
-
Maximum charge and regenerative-current conditions.
-
Minimum and maximum state of charge when internal cell loss or control limits differ.
-
Cooling degraded, blocked, or disabled according to the approved fault analysis.
-
One parallel path at the highest credible current imbalance.
-
Preconditioned samples after thermal cycling and vibration.
-
Minimum-thickness and worst-tolerance busbars with the approved joint process.
-
Sensor fault or displaced production sensor, with BMS detection and derating checked.
-
Post-test micro-ohm measurement and visual inspection for discoloration, plating damage, insulation deformation, looseness, or fretting.
The UL overview of battery module and pack testing identifies environmental, cycling, vibration, and application-specific safety evaluations. Use the actual destination-market standard and certification plan; do not claim compliance merely because an internal test resembles part of a published program.
Set acceptance limits from the weakest component
The maximum permitted busbar or joint temperature may be limited by cell terminals, seals, insulation, nearby polymers, contactors, connectors, sensors, adhesives, cable lugs, or enclosure touch-temperature requirements. Evaluate absolute temperature and temperature rise above a well-defined ambient reference. Include measurement uncertainty and sensor attachment error.
Also set electrical limits for voltage drop and resistance growth. Compare parallel paths and symmetric joints. A local joint that is warmer than its peers under equal current is valuable diagnostic evidence even if all points remain below an absolute limit. Define stop criteria for unexpected heating, smoke, odor, swelling, protective trips, or unstable measurement.
The busbar creepage and clearance guide should be reviewed together with the thermal design. Increasing cross-section or changing a bend can reduce resistance while reducing electrical clearance or creating an insulation assembly problem.
Supplier and OEM evidence checklist
The buyer should request controlled drawings with material, temper, plating, minimum thickness, dimensional tolerances, hole and bend data, fastener stack, torque process, surface preparation, and inspection characteristics. Require conductor resistance calculations, joint micro-ohm results, thermal maps, raw temperature-rise records, sensor layout, current profiles, cooling state, environmental conditions, test-equipment status, deviations, and retest evidence.
Production controls should cover incoming material certificates, thickness and plating checks, burr and cleanliness inspection, fastening traceability, tool calibration, resistance sampling, end-of-line functional data, nonconformance handling, and written change control. Freeze the approved busbar and joint process. Substituting copper grade, plating, washer, lubricant, fastener, adhesive, insulation, or enclosure airflow can change the validated result.
Frequently asked questions
Is there one safe current-density limit for a copper battery busbar?
No. Current density is a preliminary sizing indicator. Final acceptance depends on geometry, joints, material tolerances, current profile, cooling, ambient, enclosure, neighboring components, electrical clearances, and measured temperature rise in a production-representative pack.
Why can a bolted joint be hotter than the busbar conductor?
The interface can add substantial micro-ohm resistance through low clamp load, oxide, contamination, poor flatness, plating damage, burrs, an incorrect washer stack, or process variation. Because heat equals current squared times resistance, a small resistance increase becomes significant at high current.
What data should a battery busbar temperature-rise report contain?
Record the test configuration, current profile, state of charge, ambient, cooling state, voltage drop, micro-ohm values, sensor locations, temperatures versus time, thermal images with emissivity settings, protection status, instrument identification, acceptance limits, deviations, and post-test inspection.
When should busbar resistance and thermal testing be repeated?
Repeat it after changes to geometry, material, plating, fasteners, torque process, joint preparation, insulation, enclosure, cooling, cell or connector interfaces, current profile, or firmware limits when the change can affect electrical or thermal performance. Revalidate after relevant aging or mechanical stresses.
Contact FISSION Lithium
For an industrial LiFePO4 battery-pack review, send the voltage, current profile, duty cycle, ambient range, cooling architecture, busbar drawing, joint process, pack layout, destination market, and required validation plan to FISSION Lithium / Zhejiang Feixiang Technology Co., Ltd.
-
Email: [email protected]
-
Telephone: +86 18969667183